Machine Learning Lab
trained live in your browser
Five small tools for everyday problems, each built on a model written from scratch in TypeScript and trained live in the browser. No ML libraries, no pretrained models.
Calling a model API shows I can wire a product. It does not show I know what happens inside the model. This lab is the other half: machine learning fundamentals, written by hand, small enough to read and live enough to poke at.
Each tool covers one idea: collaborative filtering, reinforcement learning, backpropagation, unsupervised learning and the explore versus exploit trade-off. Each one also answers a question people actually have: what to watch together, whether to repair or replace, what comes before a bad day, which colours a brand already uses, and whether a split test is done. You can watch every one of them learn.
All five follow the same rules. The model code lives in its own folder next to the demo, as files such as autograd/value.ts or brain/agent.ts, with no React inside.
- Pure TypeScript functions: every model is plain functions over arrays. No TensorFlow.js, no ONNX, no math library, no pretrained weights.
- Seeded randomness: each experiment uses its own seeded generator, so a run can be replayed and a result reproduced.
- Training off the main path: the loop runs a small slice of work inside requestAnimationFrame, or in a Web Worker for Palette Grade, so the charts move and the page never freezes.
- Every number measured: the results on the notes pages come from running the same code in Node, not from a paper or a guess.
Matrix factorization + group aggregation
A tool for the nightly what do we watch standoff. Two to six people each rate a few films, and every person becomes a row after 60 synthetic users who act as a backbone crowd. A biased matrix factorization model, trained with hand written SGD and an L2 penalty, fills in each person's missing ratings.
A fairness rule then picks the top three from the 40 film catalog: Fair (best average, skipping any film someone is predicted below 3), No veto (maximize the lowest score) or Crowd-pleaser (plain average). Each pick shows everyone's predicted stars, the group's lowest score, a one line reason and a confidence label.
| Model | Held-out RMSE |
|---|---|
| Global mean | 1.076 |
| Bias only (user + film) | 0.970 |
| Matrix factorization, k 2 | 0.753 |
| Noiseless truth (floor) | 0.613 |
Q-learning vs value iteration
A repair or replace planner. The world is the textbook machine replacement problem: 99 states of age, condition and this year's bill, two calls, keep or replace, and costs in dollars taken from the visitor's own numbers. A tabular Q-learner, with SARSA as the cautious option, rehearses 150,000 simulated lives and writes a keep or replace cut list.
Value iteration solves the same model exactly. Every cell where the learner disagrees is outlined, the agreement is shown as a percentage, and the verdict sentence and the baselines (the 50% rule, drive till it dies, replace every N years) are priced with 3,000 shared Monte Carlo futures.
| Measure | Result |
|---|---|
| Agreement with value iteration, car, median of 20 seeds | 96% |
| Same, phone · laptop · fridge | 91% · 94% · 98% |
| Car, 10 year cost, exact plan | $16,530 |
| Car, 10 year cost, 50% rule | $17,660 |
| Car, 10 year cost, learned plan | about $16,940 |
Autograd MLP + cross-validated screening
A personal trigger finder for daily symptom and mood logs. Paste or upload a diary export (a hand-written CSV parser handles quotes, semicolons, DD/MM dates, 7:30 durations, units and Daylio activity lists), pick what counts as a bad day, and pick the factors to screen.
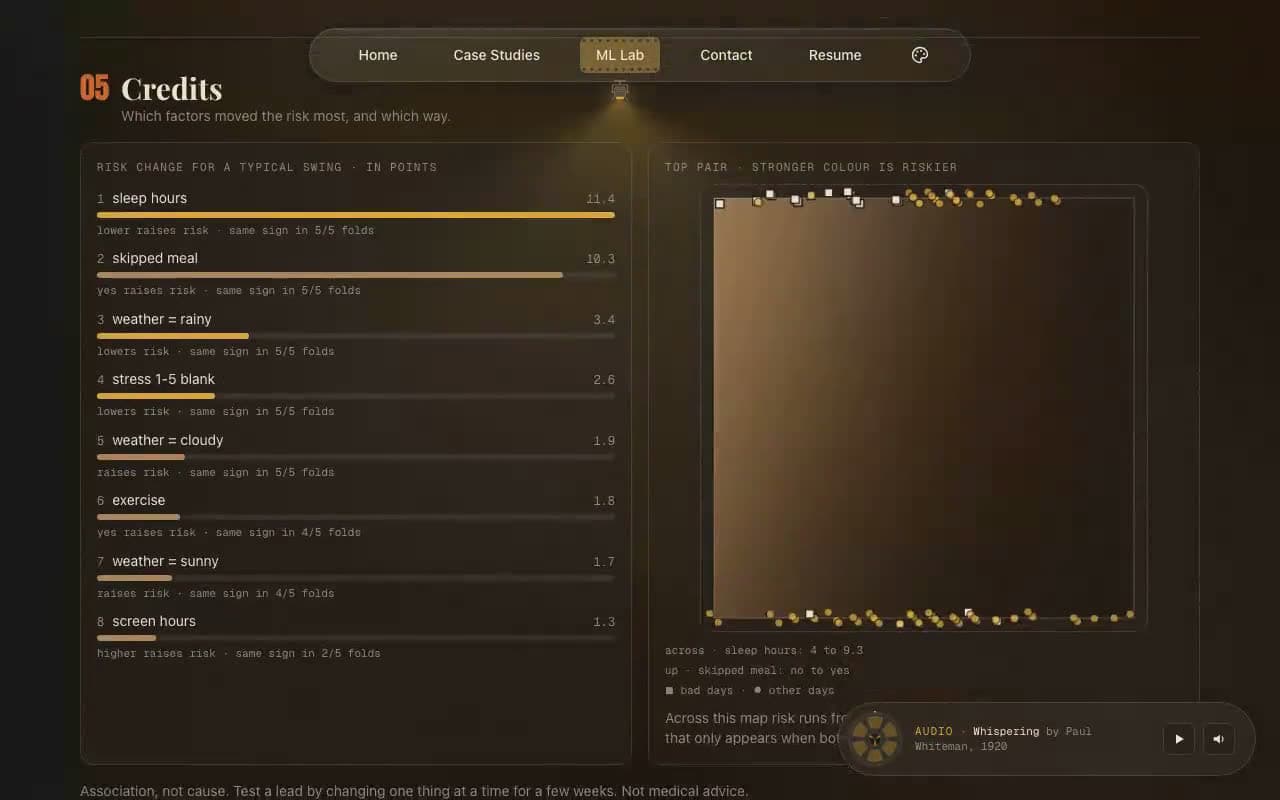
A scalar autograd engine trains a base rate, a logistic model and a one-hidden-layer MLP on five folds of consecutive days. If the MLP does not beat the base rate on held-out log-loss by more than its fold spread, the verdict is no reliable signal yet. Otherwise, factors are ranked by input gradients ∂p/∂x, the top pair gets a partial dependence map, and sliders give today's risk with its spread across folds.
| Measure | Result |
|---|---|
| Sample: held-out log-loss, base · logistic · MLP | 0.550 · 0.455 · 0.447 |
| Sample: MLP gain over base rate | 0.103 ± 0.067 · signal |
| Shuffled labels: gain | 0.004 ± 0.041 · no signal |
| Planted causes in top two credits, 5 seeds | 5 of 5 |
| Gradient check, worst error: 121 weights · 1,248 inputs | 2.1e−5 · 2.2e−6 |
k-means++ in CIELAB
A palette tool for brands, websites and rooms. Images are decoded with canvas in the browser, downscaled to about 20,000 pixels and converted to CIELAB, where k-means++ clusters them. Silhouette on a 1,500 pixel subsample picks k from 3 to 10, near duplicates under ΔE 5 merge, and each swatch snaps to a real pixel so every colour exists in the image.
An accent slot keeps the most saturated small cluster that k-means absorbed. Each swatch gets a pixel share and a suggested role, every pair gets a WCAG contrast ratio, and the palette exports as CSS, Tailwind v4, Tailwind v3 or JSON. The three nearest of the forty film palettes show what it is graded like.
| Measure | Result |
|---|---|
| Grade time, 20,000 pixels in Node | 0.3 to 1.0 s |
| Best silhouette, Dark site sample | 0.709 at k 3 |
| Samples where the accent slot kept a colour | 4 of 4 |
| Text on background, Lamplit study | 9.30:1 |
| Black on white contrast check | 21:1 |
Bayesian A/B testing + Thompson sampling
A split test checker for people with small traffic: newsletter writers, small shops, job seekers. Enter visitors and conversions for 2 to 6 versions and it gives a verdict (ship, keep running, or too close to matter), the chance each version is best, a 95% range for each rate, and how to split tomorrow's traffic.
Each version gets a Beta(1 + conversions, 1 + misses) posterior. 20,000 seeded draws per version, from a Beta sampler written from scratch, give probability to be best and expected loss. It ships when the leader's expected loss falls under the smallest lift you care about. The traffic split is Thompson sampling's own, and the original bandit simulation stays below the tool to show why it works.
| Check | Result |
|---|---|
| 12/200 vs 9/200, chance A is best (20,000 draws) | 74.5% |
| Same, exact by numerical integration | 74.4% |
| Expected loss of A, draws vs exact | 0.348 vs 0.353 points |
| Thompson regret at 10,000 visitors | 48.7 ± 1.1 |
| UCB1 regret at 10,000 visitors | 256.5 ± 0.9 |
- The built in data is synthetic or approximated by hand. The 60 backbone film raters are invented, Final Cut and the bandit explainer run on simulated years and clicks, Final Cut's breakdown odds are a simple curve, not data from any make or model, and the forty film palettes behind Palette Grade's matches are six colours per film picked from memory, not measured from footage.
- Visitor data stays in one browser. Film ratings, Final Cut's item numbers and Dailies logs live in localStorage, images are read only inside the page, and split test numbers live only in the page link. Nothing is sent to a server, so nothing learns from the whole audience.
- The models are small on purpose. A table of 198 numbers, a network trained on one person's diary and k-means on 20,000 pixels all work because the problems are small.
- These are decision aids, not advice. Dailies shows patterns in one log, not causes or a diagnosis, and Final Cut and Box Office Verdict are only as good as the numbers typed in.
- Each notes page lists its own failure modes, with numbers, for what breaks when the settings are pushed.
Every tool runs in your browser, with nothing to install. Settle movie night, plan a repair, call a split test.
Open the Machine Learning Lab